FREE FPS BENCHMARK
Frame Rate Test: Measure Live FPS & Browser Performance
Want to know if your browser or hardware is holding back smooth visuals? This tool measures your system’s real-time FPS and frame pacing with a live graph, offering instant insights into how your device handles animated web content. You get live FPS metrics, min, max, average, 1% low, and 0.1% low numbers, plus detailed frame-time charts and system info, all in your browser.
What Does This Tool Do?
The Frame Rate Test is a browser-based utility that checks how well your device handles real-time graphics directly in your web browser. It monitors live frames per second (FPS) using requestAnimationFrame, giving you precise stats like average, minimum, and maximum FPS, as well as 1% and 0.1% low values for frame pacing analysis. The test includes an animated GPU stress scene, letting you toggle between Off, Low, Medium, High, and Extreme load settings. This stresses your graphics pipeline and shows how your device copes under varying workloads.
You will also see frame time in milliseconds, a pacing score, and easy-to-read FPS and frame-time charts. The tool automatically collects information about your browser, operating system, and GPU to help you compare results. If you want to export your data, you can grab a JSON file with the complete summary. The companion device comparison table lets you benchmark your setup against others.
How to Use This Tool
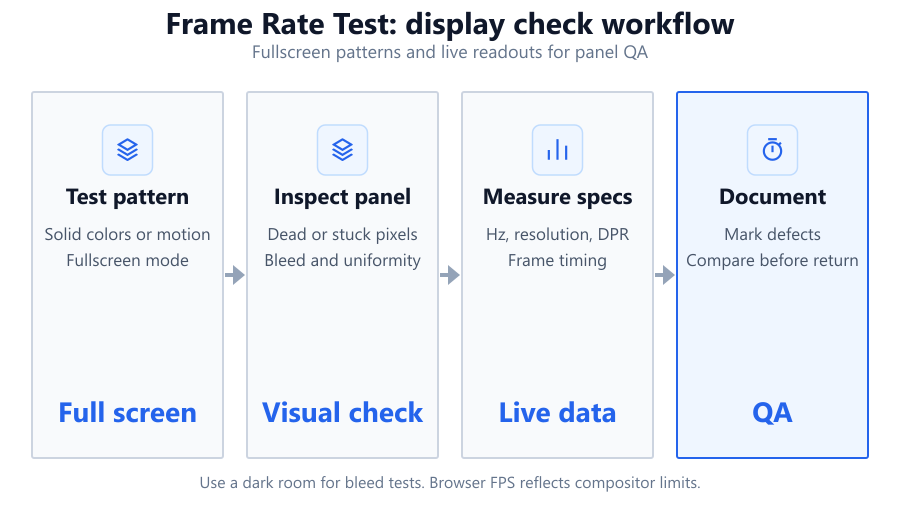
Start by opening the Frame Rate Test on your browser, any modern Chromium, Firefox, or Safari-based browser will work. Choose your desired GPU stress load from Off to Extreme. The animated scene will play and the tool immediately begins recording FPS and frame timings. Watch the real-time graphs update as the test runs.
Let the test run for at least 30 seconds for more accurate averages. Make sure nothing else is stressing your CPU or GPU in the background, such as video streams or games. When you are done, review the summary: you will see current, average, min, max, 1% low, and 0.1% low FPS, plus frame time metrics. You can enter fullscreen for a more immersive test and export your results in JSON format for later comparison or sharing.
The tool also detects your browser, OS, and GPU details automatically and displays them for easy reference, so you know exactly what was tested.
Understanding Your Results
The tool gives you several key metrics. Current FPS shows what you are getting at any given second. Average FPS is calculated over the length of your test. Minimum and maximum FPS show the lowest and highest points recorded. The 1% low and 0.1% low FPS are especially important, they highlight the slowest 1% and 0.1% of frames, which often cause visible stutter or lag. A high average FPS with poor 1% low or 0.1% low means your experience will feel choppy despite a high overall frame rate.
Frame time, measured in milliseconds, tells you how long each frame takes to render. Lower is better, and consistent frame times are ideal. The pacing score summarizes how evenly frames are delivered. The included charts let you spot spikes or dips that may indicate background processes or thermal throttling. All results are approximate and depend on your browser’s ability to accurately measure animation timing. The tool also lists your detected hardware and browser, making it easy to compare setups.
Common Problems This Helps Diagnose
Browser-based FPS tests are great for spotting a range of issues. If your system stutters, it may be a sign of thermal throttling, outdated drivers, or background tasks eating resources. Sudden FPS drops during the test can also point to power-saving modes kicking in or network activity interfering with performance.
If you recently upgraded your GPU, this test can confirm your browser is actually using the right graphics adapter. Swapping from integrated graphics to a discrete card, like moving from Intel UHD to an Nvidia GeForce RTX 3060, should show a clear jump in FPS under GPU load.
Inconsistent frame times may reveal browser-specific problems. Some browsers handle JavaScript animation loops better than others. If you switch from Chrome to Firefox and see smoother frame pacing, you have evidence to help troubleshoot or select a better browser for web gaming or creative tools.
The tool also helps spot issues related to hardware acceleration settings or OS-level graphic drivers. If you use a monitor with a high refresh rate, like an ASUS ROG Swift 240Hz, but only see 60 FPS, your browser or OS may be limiting your frame rate.
Examples and Scenarios
Scenario 1: Office Laptop vs Gaming Desktop You run the test on a Dell XPS 13 with Intel Iris Xe graphics and get 32 average FPS on High GPU load. On your home desktop with an Nvidia RTX 4060 and Intel Core i5-13600K, you see 120 FPS average, with tighter 1% lows. The result helps you decide which device is better for browser games or web-based creative tools.
Scenario 2: Integrated vs Dedicated GPU A Lenovo ThinkPad with both Intel UHD and AMD Radeon 660M shows 40 FPS on integrated and 90 FPS on discrete GPU. This confirms your browser is using the right graphics adapter after a recent driver update.
Scenario 3: Browser Comparison You test the same PC in Microsoft Edge (Chromium), Chrome, and Firefox. Chrome reports smoother frame pacing and higher 1% lows, while Firefox occasionally drops to 45 FPS. This highlights the browser’s impact on graphical performance and helps you choose the best browser for web-based applications.
Scenario 4: High Refresh Rate Monitor Not Utilized Your Alienware AW2521H (360Hz) is connected, but the test never exceeds 60 FPS. You discover that Windows is set to 60Hz in Display Settings. Once you switch to 360Hz, the browser test immediately shows up to 350 FPS, revealing a misconfiguration.
Scenario 5: Diagnosing Stutter During Video Calls You notice frame time spikes during video calls in another browser tab. Running the test while multitasking reveals that heavy background loads, like Zoom or Teams, can cause FPS drops even on high-end hardware like a MacBook Pro M2.
Scenario 6: Laptop Power Saving and Thermal Throttling Your Razer Blade 15 runs the test at 144 FPS when plugged in, but drops to 80 FPS on battery. The tool helps confirm that aggressive power saving and thermal throttling are active, prompting you to adjust your power settings or cooling.
Tips for Accurate Testing
Close unnecessary tabs and background apps before running the test. Web browsers share CPU and GPU resources across all open windows. For best results, use a dedicated test window and keep your device plugged in, especially on laptops. Disable battery saver or power saving modes that might limit performance.
If possible, set your monitor to its maximum refresh rate in your OS settings. For example, if you are using a Dell S2721DGF, make sure it is set to 165Hz instead of the default 60Hz. Run the test for at least 30 seconds to get stable averages and low-percentile data. Use fullscreen mode to reduce browser chrome overhead.
Ensure your browser and GPU drivers are up to date. Hardware acceleration should be enabled in browser settings for proper GPU load. If you are running the test on a desktop, make sure you are using your discrete GPU, not integrated graphics. Finally, use the JSON export to record your results, especially if you plan to compare multiple devices or configurations.
Browser vs Desktop Software
Browser-based frame rate tests are convenient, but have some limits. They measure performance in your browser’s environment, using JavaScript and the requestAnimationFrame API. This means results can vary between browsers and are not as precise as tools like FRAPS, MSI Afterburner, or NVIDIA FrameView, which hook directly into the graphics driver and measure actual rendered frames in native games or applications.
Browsers may cap FPS based on OS settings or power profiles. Input polling and rendering are subject to the browser’s event loop, which is not always as fast as a dedicated game engine. Features like G-Sync or FreeSync may not be fully utilized. If you need lab-grade precision, or want to measure actual in-game FPS, use desktop tools. But for quick checks, browser-based tools give a practical, easy-to-share baseline, especially if you want to compare hardware or spot obvious configuration issues.
Summary
The Frame Rate Test is a fast, browser-based way to measure your device’s real-time FPS, frame times, and system info. It is ideal for spotting stutters, comparing hardware, and confirming browser or OS settings, without any installs. While its results are approximate and limited by browser measurement accuracy, the tool is great for troubleshooting, comparing devices, or sharing performance data.
For the most accurate results, keep your drivers and browser up to date, close other apps, and use fullscreen mode. If you need professional-grade benchmarks or want to test demanding titles, supplement this test with desktop apps like MSI Afterburner or NVIDIA FrameView. But for most users, this tool delivers a quick, clear snapshot of browser performance and hardware capability.
Frequently Asked Questions
How accurate is a browser-based frame rate test compared to desktop software?
Browser-based frame rate tests use JavaScript and your browser’s animation loop to measure FPS. They are very useful for quick checks and comparisons but are less precise than desktop tools like FRAPS or MSI Afterburner, which hook directly into the graphics pipeline. Browsers can be throttled by OS, background tasks, or power-saving features. Expect results within 5-10% of reality for most systems, but do not use browser tests for professional benchmarking or competitive overclocking.
What is the difference between average FPS and 1% low or 0.1% low FPS?
Average FPS is the mean frame rate over the test duration. 1% low FPS is the average of the slowest 1% of frames, and 0.1% low measures the slowest 0.1%. These low-percentile numbers are crucial for spotting stutter: your gaming or animation experience depends more on consistent frame delivery than just the average. High average FPS with low 1% or 0.1% lows means you may experience micro-stutter or lag, which can be distracting in fast-paced scenarios.
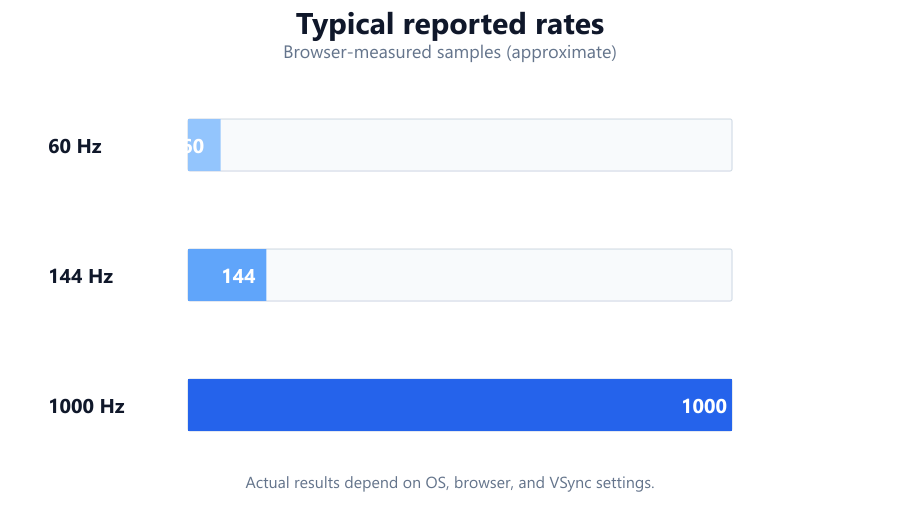
Why does my browser FPS cap at 60 or 144 even with a high refresh rate monitor?
Browsers often default to 60Hz for compatibility, regardless of your monitor’s maximum refresh rate. Check your OS display settings to ensure your monitor, for example an ASUS VG259QM, is set to its rated refresh rate. Also, some browsers or operating systems limit requestAnimationFrame to 60Hz, especially on battery or power saving modes. Try enabling fullscreen and updating your browser to the latest version. If the cap remains, consider using a different browser or checking for hidden OS settings.
Can this tool detect if my system is using the integrated or discrete GPU?
The tool reads GPU info reported by your browser, which is often accurate on desktops and many laptops. On dual-GPU laptops, like a Lenovo Legion with Intel and Nvidia graphics, you may need to force the browser to use the discrete GPU via OS graphics settings. The detected GPU name is shown on the results page, but some browsers may show generic labels or only partial driver info. For detailed GPU switching control, use your OS settings or manufacturer’s control panel.
What is frame time, and why does it matter as much as FPS?
Frame time is the time, in milliseconds, that your system takes to render a single frame. Consistent frame times are critical for smooth animation: 16.6ms per frame equals 60 FPS, while 8.3ms equals 120 FPS. Spikes or variability in frame time cause stutter, even if your average FPS is high. The Frame Rate Test displays frame time charts so you can spot irregularities, which often signal CPU or GPU bottlenecks, background apps, or power management.
How can I improve my browser’s FPS during this test?
Close unnecessary tabs and background apps, keep your device plugged in, and switch off battery saver modes. Update your graphics drivers and browser. Make sure hardware acceleration is enabled in browser settings. If you are on a laptop with switchable graphics, force your browser to use the discrete GPU in your OS’s graphics settings. Set your monitor to its maximum refresh rate. For example, with a Samsung Odyssey G7, ensure 240Hz is active in Windows Display Settings.
Does this tool work on phones and tablets?
Yes, the Frame Rate Test runs on most modern smartphones and tablets using Chrome, Safari, or Firefox. Results may be less precise due to mobile OS resource management and browser limitations. Touchscreen input and variable refresh rates on some devices can also affect measurements. For the most reliable results, ensure your device is charged, in performance mode, and no other heavy apps are running during the test.
Why are my FPS results different between browsers like Chrome and Firefox?
Different browsers use different rendering engines and handle JavaScript animation loops in their own ways. Chrome, Edge (Chromium), and Opera often provide higher, more stable FPS than Firefox or Safari on the same hardware. Some browsers throttle background tabs or have different approaches to hardware acceleration. If you see big differences, it is not your hardware, it is the way each browser schedules and renders frames.
Should I use fullscreen mode for this test?
Fullscreen mode often results in more accurate FPS readings because it reduces browser and OS overhead, disables unnecessary UI elements, and sometimes allows higher refresh rates. For multi-monitor setups or high-refresh displays, always test in fullscreen to ensure your browser is not capping performance due to windowed mode limitations. However, some browsers may still impose FPS caps even in fullscreen, depending on the OS and hardware.
Can I use this tool to benchmark my gaming PC or laptop for actual games?
This tool provides a good indicator of browser-based graphics and animation performance. It helps you compare hardware, spot configuration issues, or check for stutter. However, it does not measure in-game FPS for titles like Cyberpunk 2077 or Fortnite. For real game benchmarking, use dedicated software such as MSI Afterburner, NVIDIA FrameView, or built-in game benchmarks, which hook into the graphics pipeline at a lower level.
How long should I run the test for reliable results?
Run the test for at least 30 seconds, and ideally 1-2 minutes, to allow the average, 1% low, and 0.1% low numbers to stabilize. Short runs may not capture infrequent stutters or thermal throttling effects, especially on laptops or passively cooled devices. For more thorough comparisons or troubleshooting, run the test at multiple GPU load settings and in various browsers.
What is the GPU stress scene, and should I use it?
The GPU stress scene is an animated workload that increases graphical demand in your browser. By toggling between Off, Low, Medium, High, and Extreme, you can simulate everything from basic web animations to heavier 3D-like effects. Use higher settings to see how your system handles demanding browser content or to check for throttling and frame pacing issues. For basic FPS measurement, use Off or Low; for stress testing, use High or Extreme.
Why does my FPS drop when I open other tabs or apps during the test?
Browsers and operating systems share CPU and GPU resources across all running programs. Opening other tabs, streams, or resource-intensive apps can reduce the available performance for the Frame Rate Test, causing FPS drops or stutter. Some browsers also throttle background tabs or deprioritize rendering in non-active windows. For the best results, close other apps and keep the test in the foreground.
Is the JSON export useful for sharing or tracking my results?
Yes, the JSON export provides a detailed snapshot of your FPS, frame time, system info, and all measured metrics. This makes it easy to share results with friends, compare different devices, or keep a record for troubleshooting over time. You can also contribute your data to online comparison tables or forums, or use it to track improvements after hardware or software changes.
What system info does the tool collect, and is my privacy protected?
The tool collects basic system info: browser version, operating system, and GPU identification string as reported by your browser. No personal or identifying information is gathered. This info helps compare results and diagnose issues. You can export your results, but all data remains local unless you choose to share it. Always check privacy policies if using third-party testing tools.
Can I use this test to check if my monitor’s variable refresh rate (VRR) is active?
Browser-based tools may not fully utilize or detect VRR features like G-Sync or FreeSync, especially since browsers do not expose VRR status. However, you can spot indirect clues: if your monitor supports 120Hz or higher and you see FPS matching your refresh rate with smooth frame times, VRR is likely working. For precise VRR diagnostics, use native test apps or your monitor’s built-in OSD features.
Related Tools
Free tools to analyze, compare, and optimize your PC gaming performance
Refresh Rate Test
Measure your monitor's actual refresh rate online. Test 60Hz, 120Hz, 144Hz, 165Hz, 240Hz and higher refresh rates instan
Use Tool →GPU Stress Test
Test your graphics card stability and performance
Use Tool →Display Test
Test your monitor for dead pixels, color accuracy, gradients, response time, sharpness and display quality in one place.
Use Tool →Gaming Monitor Calculator
Find the best gaming monitor for your GPU
Use Tool →Popular Game System Requirements
Check if your PC meets the requirements for these popular games
Benchmark data from PassMark and publisher specs. Calculators run locally in your browser — we never upload your hardware info.